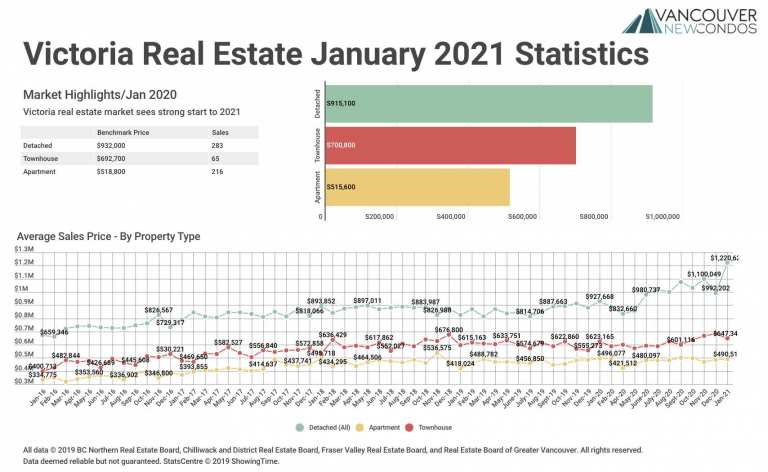
January 2021 Victoria Real Estate Board Statistics Package with Charts & Graphs
Victoria real estate market sees strong start to 2021 A total of 646 properties sold in the Victoria Real Estate Board region this January, 57.2 per cent more than the 411 properties sold in January 2020 and 2.4 per cent more than the previous month of December. Sales of condominiums were up 83.1 per…