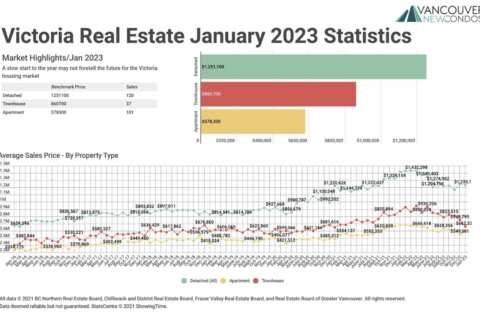
January 2023 Victoria Real Estate Board Statistics Package with Charts & Graphs
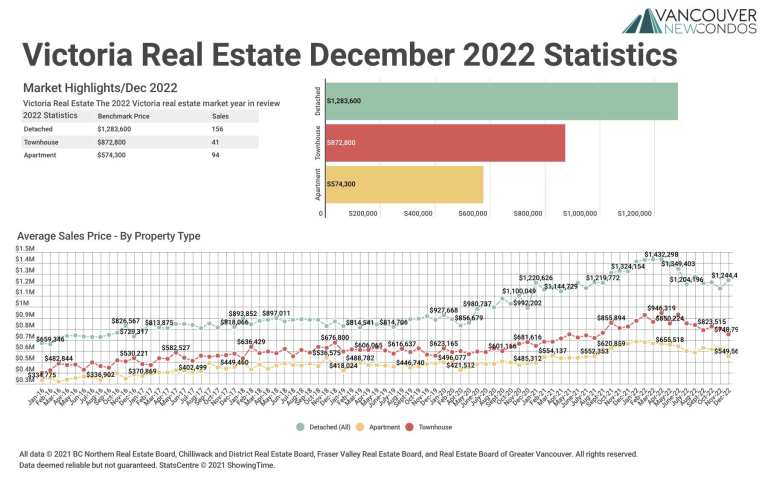
A slow start to the year may not foretell the future for the Victoria housing market A total of 278 properties sold in the Victoria Real Estate Board region this January, 41.4 per cent fewer than the 474 properties sold in January 2022 and a 13.1 per cent decrease from December 2022. Sales of…