January 2022 Victoria Real Estate Board Statistics Package with Charts & Graphs

January 2022 Victoria Real Estate Board Statistics Package with Charts & Graphs

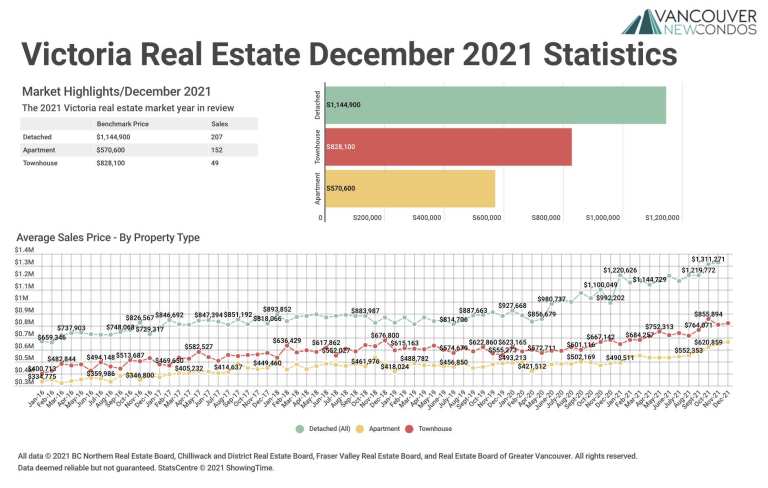
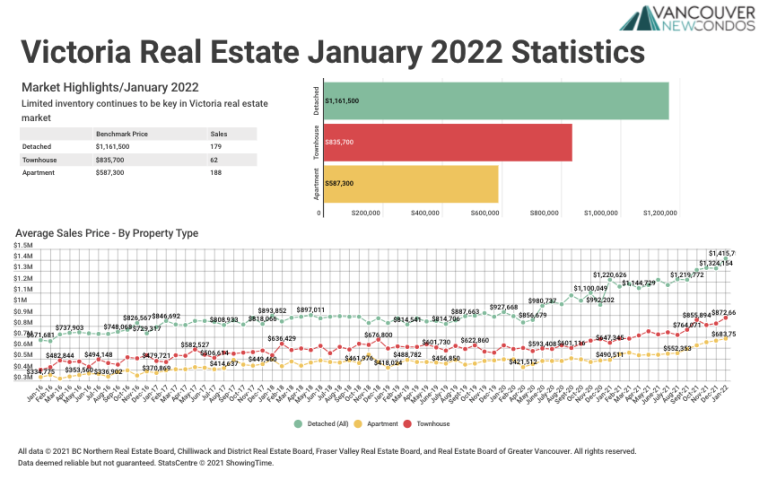
 Limited inventory continues to be key in Victoria real estate market A total of 474 properties sold in the Victoria Real Estate Board region this January, 26.6 per cent fewer than the 646 properties sold in January 2021 but an 8.2 per cent increase from December 2021. Sales of condominiums were down 13 per…

December 2021 Victoria Real Estate Board Statistics Package with Charts & Graphs

December 2021 Victoria Real Estate Board Statistics Package with Charts & Graphs

 The 2021 Victoria real estate market year in review A total of 438 properties sold in the Victoria Real Estate Board region this December, 30.6 per cent fewer than the 631 properties sold in December 2020 and a 32.9 per cent decrease from November 2021. Sales of condominiums were down 22.1 per cent from…

November 2021 Victoria Real Estate Board Statistics Package with Charts & Graphs

November 2021 Victoria Real Estate Board Statistics Package with Charts & Graphs

 No change on the horizon for the Victoria real estate market A total of 653 properties sold in the Victoria Real Estate Board region this November, 17.9 per cent fewer than the 795 properties sold in November 2020 and 12.3 per cent fewer than the previous month of October. 236 condominiums sold, 5.2 per…

October 2021 Victoria Real Estate Board Statistics Package with Charts & Graphs

October 2021 Victoria Real Estate Board Statistics Package with Charts & Graphs

 Inventory pressures continue to constrain Victoria real estate market A total of 745 properties sold in the Victoria Real Estate Board region this October, 24.7 per cent fewer than the 990 properties sold in October 2020 and 2.1 per cent fewer than the previous month of September. Condominium sales were down 18.1 per cent…

September 2021 Victoria Real Estate Board Statistics Package with Charts & Graphs

September 2021 Victoria Real Estate Board Statistics Package with Charts & Graphs

 A greater commitment to development required to balance local housing market A total of 761 properties sold in the Victoria Real Estate Board region this September, 23.1 per cent fewer than the 989 properties sold in September 2020 and 8.4 per cent fewer than the previous month of August. Condominium sales were up 9.3…

August 2021 Victoria Real Estate Board Statistics Package with Charts & Graphs

August 2021 Victoria Real Estate Board Statistics Package with Charts & Graphs

 Victoria housing market continues to adapt to long-term lack of supply A total of 831 properties sold in the Victoria Real Estate Board region this August, 15.1 per cent fewer than the 979 properties sold in August 2020 and 0.5 per cent fewer than the previous month of July. Condominium sales were up 31.7…

July 2021 Victoria Real Estate Board Statistics Package with Charts & Graphs

July 2021 Victoria Real Estate Board Statistics Package with Charts & Graphs

 Victoria housing inventory continues to decline over summer months A total of 835 properties sold in the Victoria Real Estate Board region this July, 14.7 per cent fewer than the 979 properties sold in July 2020 and 11.4 per cent fewer than the previous month of June. Condominium sales were up 18.8 per cent…

June 2021 Victoria Real Estate Board Statistics Package with Charts & Graphs

June 2021 Victoria Real Estate Board Statistics Package with Charts & Graphs

 Low inventory and strong demand continue in Victoria real estate market A total of 942 properties sold in the Victoria Real Estate Board region this June, 16.6 per cent more than the 808 properties sold in June 2020, but 10.2 per cent fewer than the previous month of May. Condominium sales were up 61.7…

May 2021 Victoria Real Estate Board Statistics Package with Charts & Graphs

May 2021 Victoria Real Estate Board Statistics Package with Charts & Graphs

 Unwavering demand reinforces need to support supply of homes The Victoria market continued to show its strength through the month of May, with a near record setting pace for sales and ongoing record low inventory levels. A total of 1,049 properties sold in the Victoria Real Estate Board region this May, 129.5 per cent…

April 2021 Victoria Real Estate Board Statistics Package with Charts & Graphs

April 2021 Victoria Real Estate Board Statistics Package with Charts & Graphs

 Housing in Greater Victoria remains in high demand “Comparing last year’s April market to 2021 does not provide us any real insight into long term market trends,” said Victoria Real Estate Board President David Langlois. “Instead of comparing to last year’s numbers, we need to look at years before the pandemic to see how…

March 2021 Victoria Real Estate Board Statistics Package with Charts & Graphs

March 2021 Victoria Real Estate Board Statistics Package with Charts & Graphs

 April 1, 2021 The fast pace of Victoria real estate market surges on A total of 1,173 properties sold in the Victoria Real Estate Board region this March, 92.9 per cent more than the 608 properties sold in March 2020 and 35.9 per cent more than the previous month of February. Sales of condominiums…

February 2021 Victoria Real Estate Board Statistics Package with Charts & Graphs

February 2021 Victoria Real Estate Board Statistics Package with Charts & Graphs

 Victoria Real Estate Market demand surges against limited supply A total of 863 properties sold in the Victoria Real Estate Board region this February, 53.3 per cent more than the 563 properties sold in February 2020 and 33.6 per cent more than the previous month of January. Sales of condominiums were up 65.7 per…

End of content

End of content