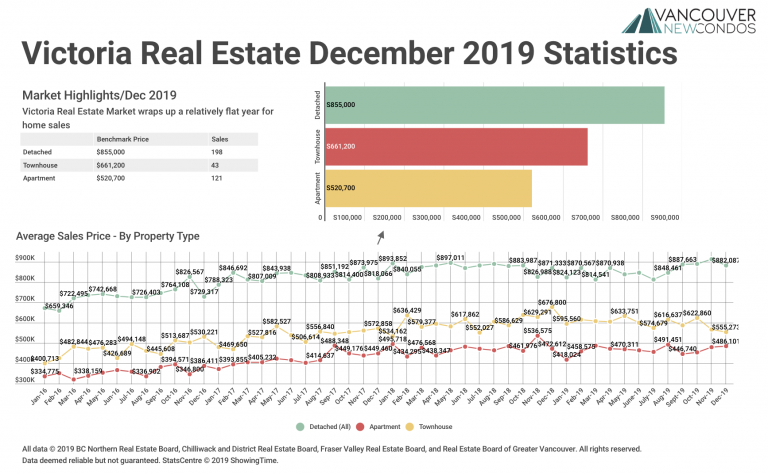
December 2019 Victoria Real Estate Board Statistics Package with Charts & Graphs
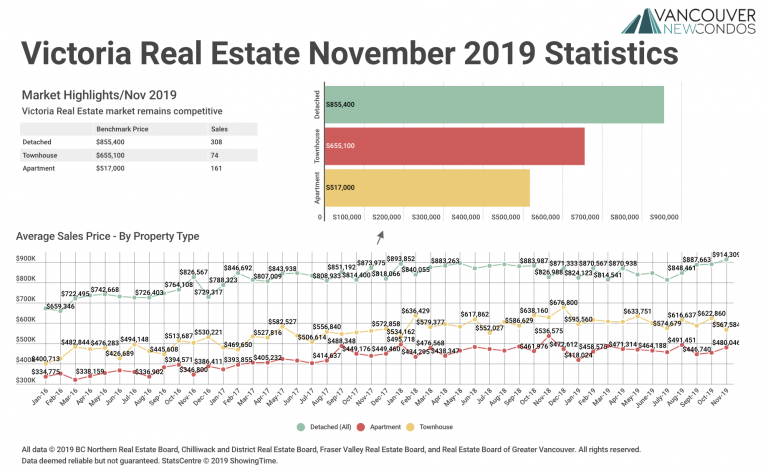
Victoria Real Estate Market wraps up a relatively flat year for home sales A total of 402 properties sold in the Victoria Real Estate Board region this December, 7.2 per cent more than the 375 properties sold in December 2018 and a 30.3 per cent decrease from November 2019. Sales of condominiums were up…