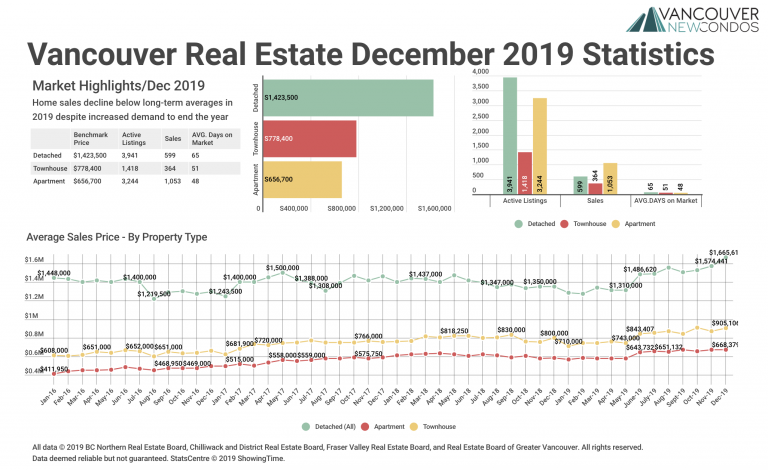
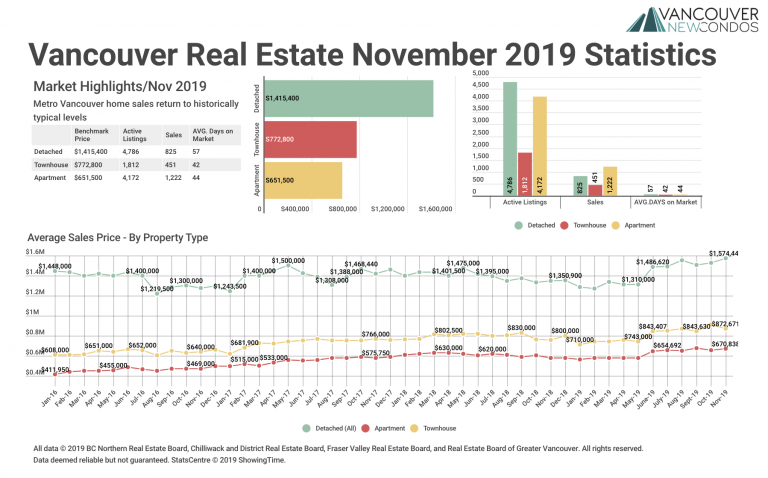
| |

‘Hot Areas to Invest in Vancouver’ August Webinar

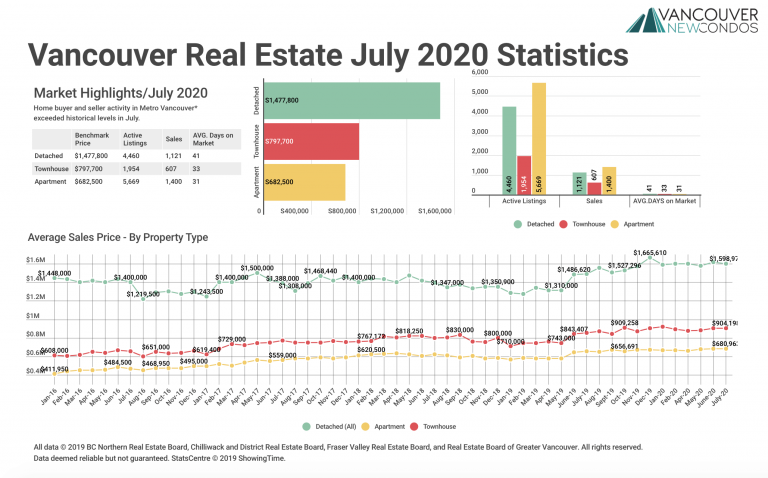
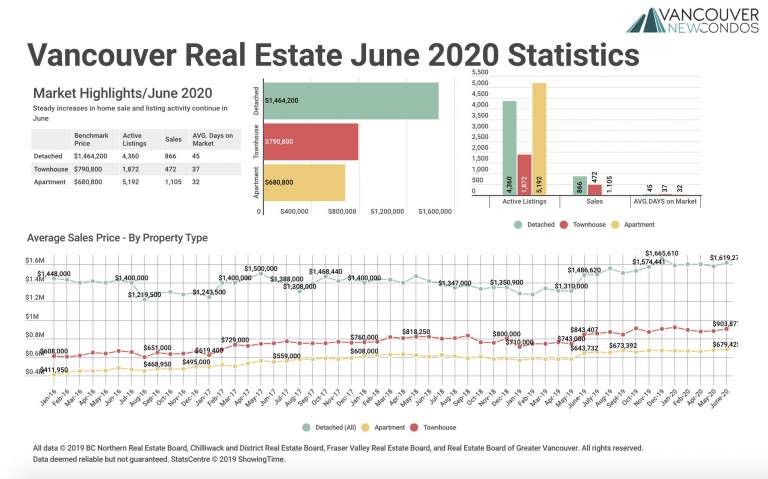
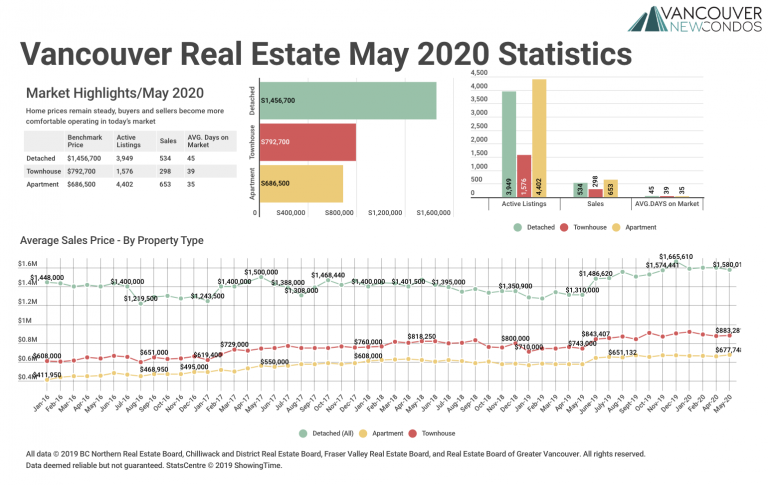
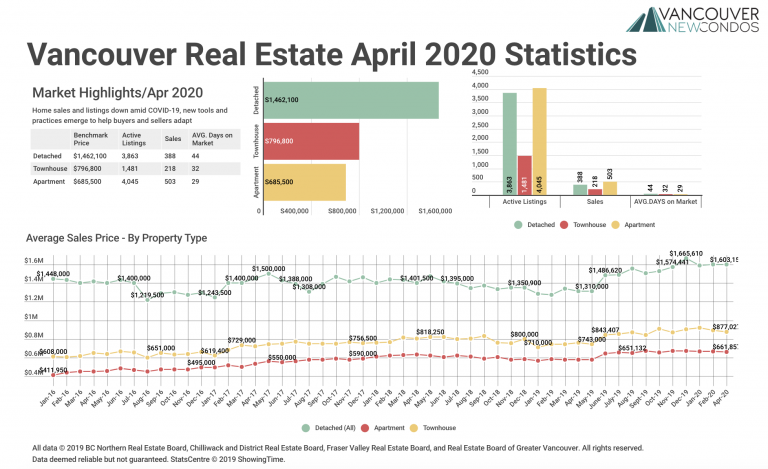
 Hot Areas to Invest in Vancouver August 12, 2020 Christian Dy, Latitude West Financial Mike Stewart, Oakwyn Realty Downtown Top producing realtor since 2005 vancouvernewcondos.com or mikestewart.ca Mike can provide this report which shows June to July median sales have gone up pretty consistently across the Lower Mainland. For example, in Coquitlam the median…

July 2020 Real Estate Board of Greater Vancouver Statistics Package with Charts & Graphs

July 2020 Real Estate Board of Greater Vancouver Statistics Package with Charts & Graphs

  Metro Vancouver housing market sees steady summer activity VANCOUVER, BC – August 5, 2020 – Home buyer and seller activity in Metro Vancouver* exceeded historical levels in July. The Real Estate Board of Greater Vancouver (REBGV) reports that residential home sales in the region totalled 3,128 in July 2020, a 22.3 per cent…

| |

‘Hot Areas to Invest in Vancouver’ July Webinar

 Hot Areas to Invest in Vancouver July 10, 2020 Christian Dy, Latitude West Financial Mike Stewart, Oakwyn Realty Downtown Top producing realtor since 2005 vancouvernewcondos.com or mikestewart.ca What is happening now with real estate in the Vancouver area? The elephant in the room right now is the COVID-19 situation. In the past couple of…

June 2020 Real Estate Board of Greater Vancouver Statistics Package with Charts & Graphs

June 2020 Real Estate Board of Greater Vancouver Statistics Package with Charts & Graphs

 Steady increases in home sale and listing activity continue in June VANCOUVER, BC – July 3, 2020 – Home buyers and sellers have gradually become more active in each month of the COVID-19 pandemic. In June, home sale and listing activity in Metro Vancouver* returned to more historically typical levels. The Real Estate Board…

May 2020 Real Estate Board of Greater Vancouver Statistics Package with Charts & Graphs

May 2020 Real Estate Board of Greater Vancouver Statistics Package with Charts & Graphs

 Home prices remain steady, buyers and sellers become more comfortable operating in today’s market VANCOUVER, BC – June 2, 2020 – Metro Vancouver* home prices have remained steady since provincial health officials implemented physical distancing requirements in March. The Real Estate Board of Greater Vancouver (REBGV) reports that the MLS® Home Price Index1 composite…

April 2020 Real Estate Board of Greater Vancouver Statistics Package with Charts & Graphs

April 2020 Real Estate Board of Greater Vancouver Statistics Package with Charts & Graphs

 Home sales and listings down amid COVID-19, new tools and practices emerge to help buyers and sellers adapt VANCOUVER, BC – May 4, 2020 – While Metro Vancouver* home sale and listing activity remains limited by the COVID-19 situation, REALTORS® across the region are fast adopting new tools and practices to help advise and…

February 2020 Real Estate Board of Greater Vancouver Statistics Package with Charts & Graphs

February 2020 Real Estate Board of Greater Vancouver Statistics Package with Charts & Graphs

  Steady demand and low supply benefits home sellers VANCOUVER, BC – March 3, 2020 – February saw steady home buyer demand and reduced home seller supply across Metro Vancouver*. The Real Estate Board of Greater Vancouver (REBGV) reports that residential home sales in the region totalled 2,150 in February 2020, a 44.9 per…

January 2020 Real Estate Board of Greater Vancouver Statistics Package with Charts & Graphs

January 2020 Real Estate Board of Greater Vancouver Statistics Package with Charts & Graphs

  Home sale activity up, supply down to start 2020 VANCOUVER, BC – February 4, 2020 – Home sale and price activity remained steady in Metro Vancouver* to start 2020 while home listing activity declined in January. The Real Estate Board of Greater Vancouver (REBGV) reports that residential home sales in the region totalled…

December 2019 Real Estate Board of Greater Vancouver Statistics Package with Charts & Graphs

December 2019 Real Estate Board of Greater Vancouver Statistics Package with Charts & Graphs

  Home sales decline below long-term averages in 2019 despite increased demand to end the year VANCOUVER, BC – January 3, 2020 – The Metro Vancouver* housing market experienced below average sales activity and moderate price declines in 2019. The Real Estate Board of Greater Vancouver (REBGV) reports that sales of detached, attached and…

November 2019 Real Estate Board of Greater Vancouver Statistics Package with Charts & Graphs

November 2019 Real Estate Board of Greater Vancouver Statistics Package with Charts & Graphs

  Metro Vancouver home sales return to historically typical levels VANCOUVER, BC – December 3, 2019 – After a quieter first half of 2019, home buyer activity has returned to more historically typical levels in Metro Vancouver*. The Real Estate Board of Greater Vancouver (REBGV) reports that residential home sales in the region totalled…

October 2019 Real Estate Board of Greater Vancouver Statistics Package with Charts & Graphs

October 2019 Real Estate Board of Greater Vancouver Statistics Package with Charts & Graphs

  Home buyer activity increases in October The Metro Vancouver housing market is experiencing a fall pickup in home sale activity. The Real Estate Board of Greater Vancouver (REBGV) reports that residential home sales in the region totalled 2,858 in October 2019, a 45.4 per cent increase from the 1,966 sales recorded in October 2018,…

End of content

End of content