skip to Main Content
REBGV Feb 2023 Stats Graph

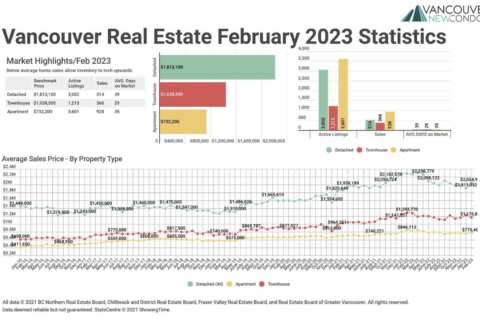
February 2023 Real Estate Board of Greater Vancouver Statistics Package with Charts & Graphs

https://youtu.be/7n5yrTBDNJc  Below average home sales allow inventory to inch upwards VANCOUVER, BC – March 2, 2023 – February listing data show a continued reluctance among prospective home sellers to…

Read more
REBGV Stats Graph

January 2023 Real Estate Board of Greater Vancouver Statistics Package with Charts & Graphs

https://youtu.be/J7AyImMJduI  Home sales decline below long-term averages and inventory remains low to start 2023 VANCOUVER, BC – February 2, 2023 – Inventory remains low in Metro Vancouver* while home…

Read more
December 2022 REBGV Stats Graph

December 2022 Real Estate Board of Greater Vancouver Statistics Package with Charts & Graphs

https://youtu.be/2znzRIdqB8Q  Rising mortgage rates brought uncertainty and caution to Metro Vancouver’s housing market in 2022 VANCOUVER, BC – January 4, 2023 – After seeing record sales and prices during…

Read more
REBGV November 2022 Stats Graph

November 2022 Real Estate Board of Greater Vancouver Statistics Package with Charts & Graphs

https://youtu.be/xqh54ar1IMo    Home sale and listing activity continue trending below long-term averages in November VANCOUVER, BC – December 2, 2022 – While typically a quiet month of market activity…

Read more
REBGV October 2022 Stats Graph

October 2022 Real Estate Board of Greater Vancouver Statistics Package with Charts & Graphs

https://youtu.be/ckb2akCW9LY  Inflation, rising interest rates create caution across Metro Vancouver’s housing market VANCOUVER, BC – November 2, 2022 – Home sale activity across the Metro Vancouver* housing market continued…

Read more
REBGV Stats Graph Sept 22

September 2022 Real Estate Board of Greater Vancouver Statistics Package with Charts & Graphs

https://youtu.be/0YHb0_M5BJU  Metro Vancouver saw more home sellers and fewer buyers in September Vancouver, B.C. – October 4, 2022 – Home sellers were more active in Metro Vancouver’s* housing market…

Read more
REBGV Aug 22 Stats Graph

August 2022 Real Estate Board of Greater Vancouver Statistics Package with Charts & Graphs

https://youtu.be/mFIoZUBmQ7w  Metro Vancouver’s housing market sees fewer home buyers and sellers in August VANCOUVER, BC – September 2, 2022 – Metro Vancouver’s* housing market is experiencing a quieter summer…

Read more
REBGV July 2022 Graph

July 2022 Real Estate Board of Greater Vancouver Statistics Package with Charts & Graphs

https://youtu.be/cNywIbkHTsk  Home buyer demand continues to ease across Metro Vancouver VANCOUVER, BC – August 3, 2022 – Metro Vancouver’s* housing market has entered a new cycle marked by quieter…

Read more
REBGV June 2022 Stats Graph

June 2022 Real Estate Board of Greater Vancouver Statistics Package with Charts & Graphs

https://youtu.be/2J3DcZ-Nu_8   Home listings up, sales down and prices starting to decrease to start the summer season VANCOUVER, BC – July 5, 2022 – With interest rates and housing…

Read more
REBGV Graph

May 2022 Real Estate Board of Greater Vancouver Statistics Package with Charts & Graphs

 Spring ushers in calmer housing market trends in Metro Vancouver VANCOUVER, BC – June 2, 2022 – After reaching record-setting levels in 2021, home sale activity has returned to…

Read more
REBGV April 2022 Stats Graph

April 2022 Real Estate Board of Greater Vancouver Statistics Package with Charts & Graphs

https://youtu.be/B9t5uXsiDCY  Metro Vancouver home sales return to more traditional levels in April VANCOUVER, BC – May 3, 2022 – Home buyer demand in Metro Vancouver* returned to more historically…

Read more
REBGV Mar 2022 Stats Graph

March 2022 Real Estate Board of Greater Vancouver Statistics Package with Charts & Graphs

 Calmer than last spring’s record pace, Metro Vancouver home buyer demand remains elevated VANCOUVER, BC – April 4, 2022 – While down from last year’s record numbers, home sale…

Read more
Back To Top
Search