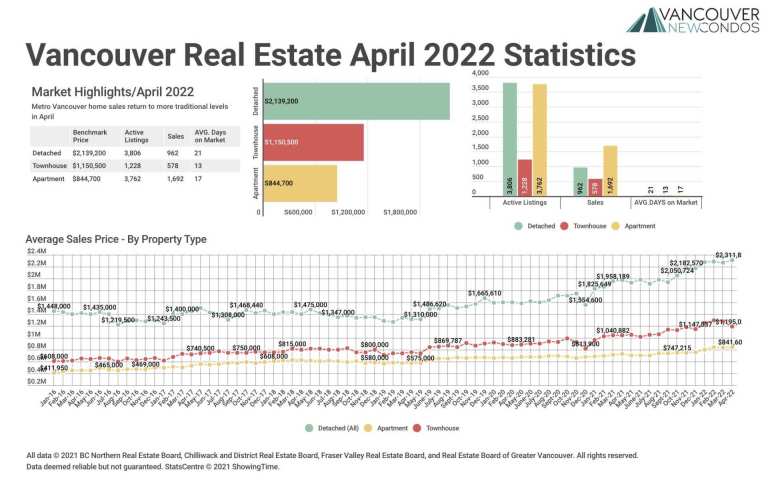
April 2022 Real Estate Board of Greater Vancouver Statistics Package with Charts & Graphs

April 2022 Real Estate Board of Greater Vancouver Statistics Package with Charts & Graphs

 Metro Vancouver home sales return to more traditional levels in April VANCOUVER, BC – May 3, 2022 – Home buyer demand in Metro Vancouver* returned to more historically typical levels in April. T The Real Estate Board of Greater Vancouver (REBGV) reports that residential home sales in the region totalled 3,232 in April 2022,…

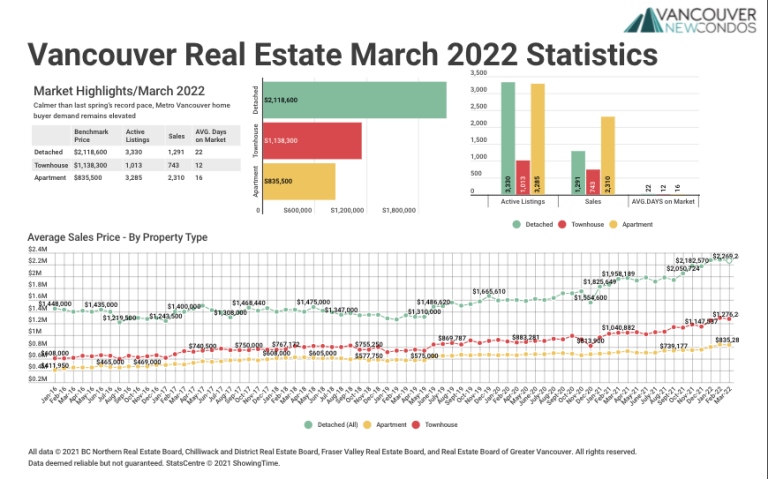
March 2022 Real Estate Board of Greater Vancouver Statistics Package with Charts & Graphs

March 2022 Real Estate Board of Greater Vancouver Statistics Package with Charts & Graphs

 Calmer than last spring’s record pace, Metro Vancouver home buyer demand remains elevated VANCOUVER, BC – April 4, 2022 – While down from last year’s record numbers, home sale activity in Metro Vancouver’s* housing market remained elevated in March. The Real Estate Board of Greater Vancouver (REBGV) reports that residential home sales in the…

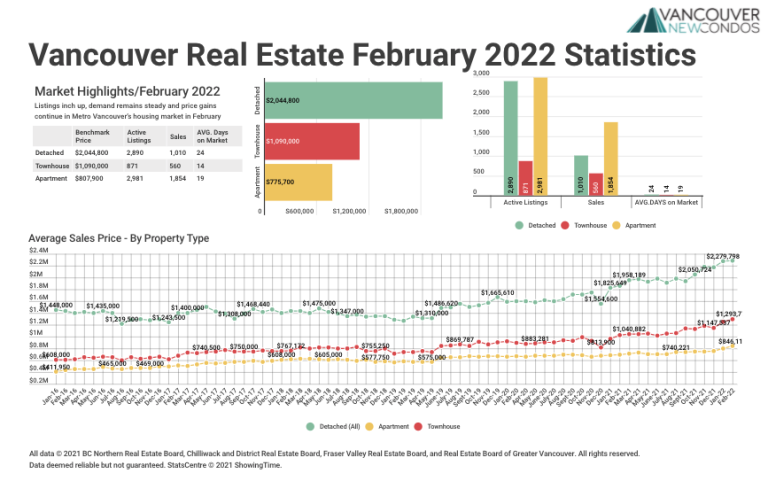
February 2022 Real Estate Board of Greater Vancouver Statistics Package with Charts & Graphs

February 2022 Real Estate Board of Greater Vancouver Statistics Package with Charts & Graphs

 Listings inch up, demand remains steady and price gains continue in Metro Vancouver’s housing market in February VANCOUVER, BC – March 2, 2022 – The Metro Vancouver* housing market saw steady home sales activity, modest increases in home listings and continued upward trends in pricing in February. The Real Estate Board of Greater Vancouver…

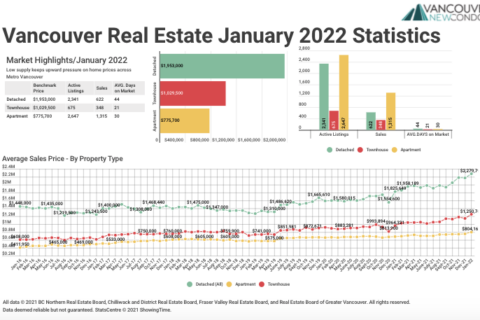
January 2022 Real Estate Board of Greater Vancouver Statistics Package with Charts & Graphs

January 2022 Real Estate Board of Greater Vancouver Statistics Package with Charts & Graphs

 Low supply keeps upward pressure on home prices across Metro Vancouver’s housing market VANCOUVER, BC – February 2, 2022 – The first month of 2022 saw home sales come down from last year’s record-setting pace, while low supply continued to cause home prices to edge higher across Metro Vancouver*. The Real Estate Board of…

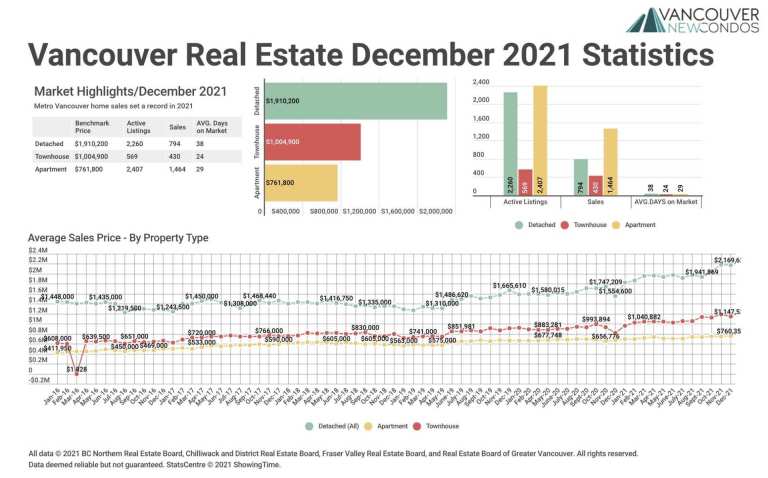
December 2021 Real Estate Board of Greater Vancouver Statistics Package with Charts & Graphs

December 2021 Real Estate Board of Greater Vancouver Statistics Package with Charts & Graphs

 Metro Vancouver home sales set a record in 2021 VANCOUVER, BC – January 5, 2022 – Metro Vancouver* home sales reached an all-time high in 2021 as housing needs remained a top priority for residents in the second year of the COVID-19 pandemic. The Real Estate Board of Greater Vancouver (REBGV) reports that residential…

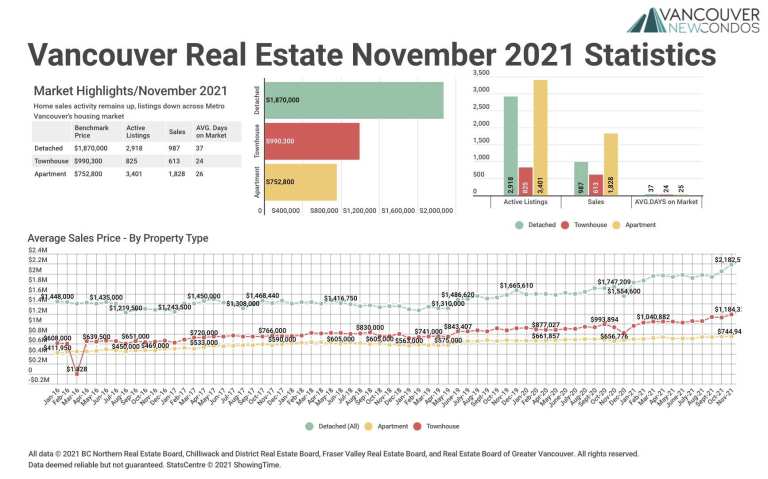
November 2021 Real Estate Board of Greater Vancouver Statistics Package with Charts & Graphs

November 2021 Real Estate Board of Greater Vancouver Statistics Package with Charts & Graphs

  Home sales activity remains up, listings down across Metro Vancouver’s housing market VANCOUVER, BC – December 2, 2021 – As we near the end of 2021, home buyer demand remains well in excess of long-term averages and the supply of homes for sale continues to decline across Metro Vancouver’s* housing market. The Real…

Best Places to Live in BC

Vancouver and the Lower Mainland Greater Vancouver or the Lower Mainland is BC’s most popular place to live because of a mix of work opportunities and a fantastic climate and lifestyle. The climate is similar to Vancouver Island, but the island doesn’t have the same level of economic and employment opportunities. Vancouver is the regional…

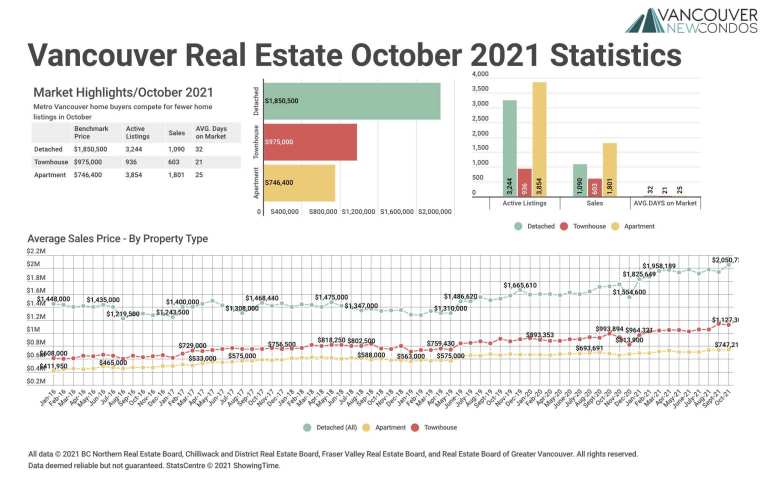
October 2021 Real Estate Board of Greater Vancouver Statistics Package with Charts & Graphs

October 2021 Real Estate Board of Greater Vancouver Statistics Package with Charts & Graphs

  Metro Vancouver home buyers compete for fewer home listings in October VANCOUVER, BC – November 2, 2021 – Home sale activity in Metro Vancouver* remained above historical averages in October while the overall supply of homes for sale dipped to levels not seen in three years. The Real Estate Board of Greater Vancouver…

| |

Real Estate Outlook Vancouver 2021 – June Webinar

Vancouver Market Update: June Market update May 2021 listings were 187% higher than the same month last year, but there was also a 13% decrease in homes sold from the prior month. When the sales-active listing ratio is below 12%, analysts believe prices will trend downward. When the ratio is above 20%, prices should trend…

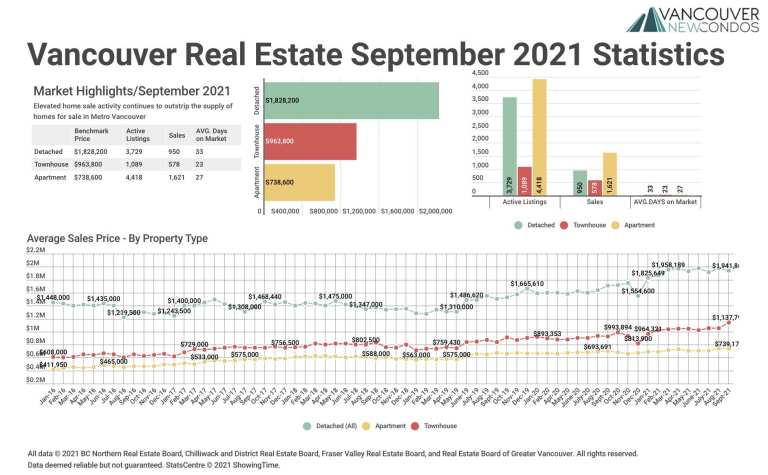
September 2021 Real Estate Board of Greater Vancouver Statistics Package with Charts & Graphs

September 2021 Real Estate Board of Greater Vancouver Statistics Package with Charts & Graphs

  Elevated home sale activity continues to outstrip the supply of homes for sale in Metro Vancouver VANCOUVER, BC – October 4, 2021 – Home sale activity remains elevated across Metro Vancouver’s* housing market while the pace of homes being listed for sale continues to follow long-term averages. The Real Estate Board of Greater…

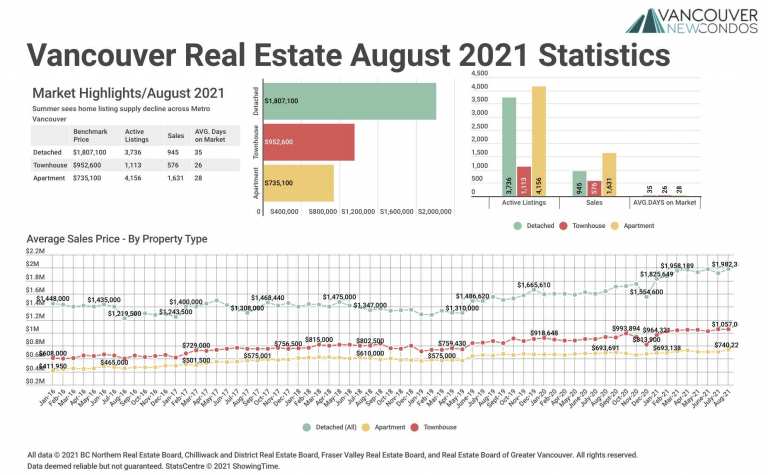
August 2021 Real Estate Board of Greater Vancouver Statistics Package with Charts & Graphs

August 2021 Real Estate Board of Greater Vancouver Statistics Package with Charts & Graphs

  Summer sees home listing supply decline across Metro Vancouver VANCOUVER, BC – September 2, 2021 – While home buyers have remained active in Metro Vancouver* throughout the summer, the supply of homes for sale has declined steadily since June. The Real Estate Board of Greater Vancouver (REBGV) reports that residential home sales in…

End of content

End of content