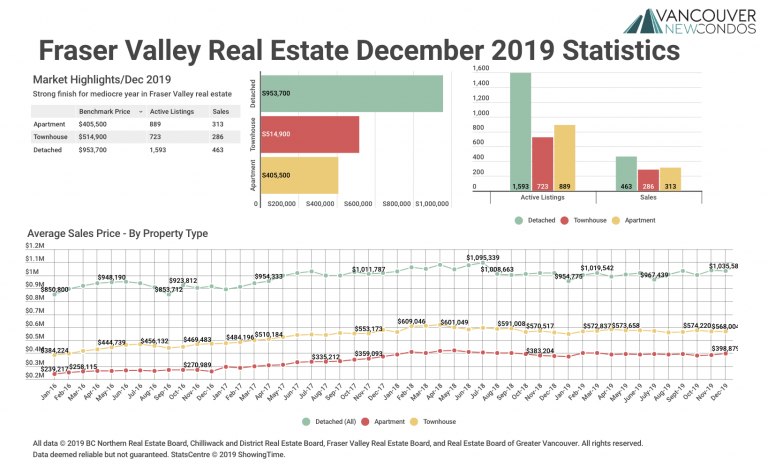
December 2019 Fraser Valley Real Estate Board Statistics Package with Charts & Graphs
Strong finish for mediocre year in Fraser Valley real estate SURREY, BC – After a sluggish first half of the year, property sales in the Fraser Valley started picking up speed in the summer and finished strong in December, but not enough to surpass last year’s sales totals. The Board’s Multiple Listing Service® (MLS®)…