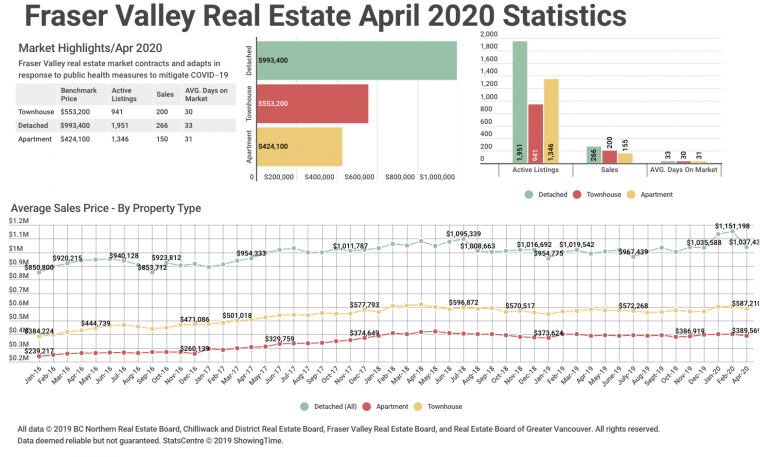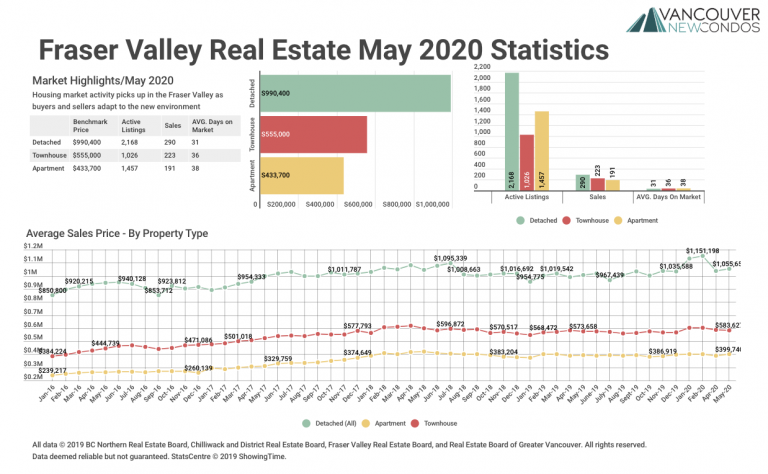
May 2020 Fraser Valley Real Estate Board Statistics Package with Charts & Graphs
Housing market activity picks up in the Fraser Valley as buyers and sellers adapt to the new environment SURREY, BC – In May, Fraser Valley listings and property sales started to bounce back as REALTORS® helped their clients adjust to the new, necessary safety measures required to buy and sell a home during the…