November 2019 Real Estate Board of Greater Vancouver Statistics Package with Charts & Graphs

November 2019 Real Estate Board of Greater Vancouver Statistics Package with Charts & Graphs

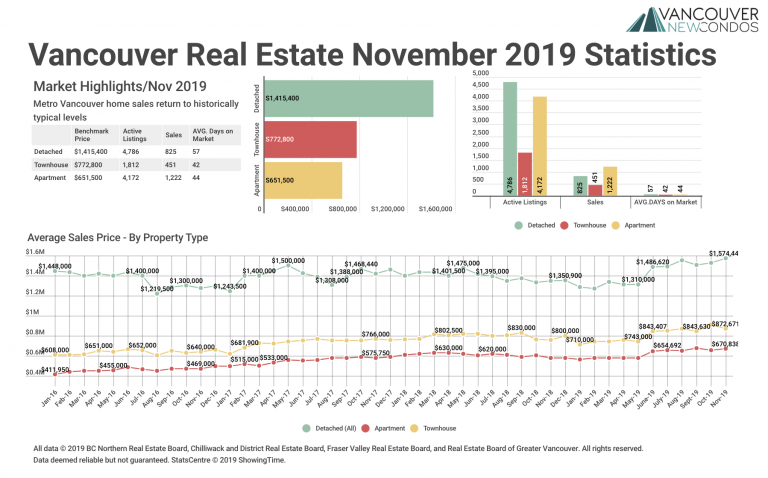
  Metro Vancouver home sales return to historically typical levels VANCOUVER, BC – December 3, 2019 – After a quieter first half of 2019, home buyer activity has returned to more historically typical levels in Metro Vancouver*. The Real Estate Board of Greater Vancouver (REBGV) reports that residential home sales in the region totalled…

October 2019 Real Estate Board of Greater Vancouver Statistics Package with Charts & Graphs

October 2019 Real Estate Board of Greater Vancouver Statistics Package with Charts & Graphs

  Home buyer activity increases in October The Metro Vancouver housing market is experiencing a fall pickup in home sale activity. The Real Estate Board of Greater Vancouver (REBGV) reports that residential home sales in the region totalled 2,858 in October 2019, a 45.4 per cent increase from the 1,966 sales recorded in October 2018,…

September 2019 Real Estate Board of Greater Vancouver Statistics Package with Charts & Graphs

September 2019 Real Estate Board of Greater Vancouver Statistics Package with Charts & Graphs

  Increased demand helps housing market reach balanced territory VANCOUVER, BC – October 2, 2019 – Home buyer demand has returned to more historically typical levels in Metro Vancouver* over the last three months. The Real Estate Board of Greater Vancouver (REBGV) reports that residential home sales in the region totalled 2,333 in September…

August 2019 Real Estate Board of Greater Vancouver Statistics Package with Charts & Graphs

August 2019 Real Estate Board of Greater Vancouver Statistics Package with Charts & Graphs

  Metro Vancouver housing market sees summer uptick in sales VANCOUVER, BC – September 4, 2019 – Home buyer activity increased to more typical levels in Metro Vancouver* throughout the summer months. The Real Estate Board of Greater Vancouver (REBGV) reports that residential home sales in the region totalled 2,231 in August 2019, a…

July 2019 Real Estate Board of Greater Vancouver Statistics Package with Charts & Graphs

July 2019 Real Estate Board of Greater Vancouver Statistics Package with Charts & Graphs

  Home sales increase in July Home buyer demand picked up across Metro Vancouver* last month, making July, a traditionally quieter month in real estate, the second highest selling month so far this year. The Real Estate Board of Greater Vancouver (REBGV) reports that residential home sales in the region totalled 2,557 in July…

June 2019 Real Estate Board of Greater Vancouver Statistics Package with Charts & Graphs

June 2019 Real Estate Board of Greater Vancouver Statistics Package with Charts & Graphs

  Housing supply up, home sales and prices down in June With home buyer demand below long-term historical averages in June, the supply of homes for sale continued to accumulate in Metro Vancouver. The Real Estate Board of Greater Vancouver (REBGV) reports that residential home sales in the region totalled 2,077 in June 2019,…

May 2019 Real Estate Board of Greater Vancouver Statistics Package with Charts & Graphs

May 2019 Real Estate Board of Greater Vancouver Statistics Package with Charts & Graphs

 May sees modest increase in home sales while housing supply reaches five-year high Monthly Metro Vancouver1 home sales eclipsed 2,000 for the first time this year in May, although home buyer demand remains below historical averages. The Real Estate Board of Greater Vancouver (REBGV) reports that residential home sales in the region totalled 2,638…

April 2019 Real Estate Board of Greater Vancouver Statistics Package with Charts & Graphs

April 2019 Real Estate Board of Greater Vancouver Statistics Package with Charts & Graphs

  Decreased demand continues to allow the supply of homes for sale to accumulate across the Metro Vancouver* housing market.The Real Estate Board of Greater Vancouver (REBGV) reports that residential home sales in the region totalled 1,829 in April 2019, a 29.1 per cent decrease from the 2,579 sales recorded in April 2018, and…

March 2019 Real Estate Board of Greater Vancouver Statistics Package with Charts & Graphs

March 2019 Real Estate Board of Greater Vancouver Statistics Package with Charts & Graphs

 The Real Estate Board of Greater Vancouver (REBGV) reports that residential home sales in the region totalled 1,727 in March 2019, a 31.4 per cent decrease from the 2,517 sales recorded in March 2018, and a 16.4 per cent increase from the 1,484 homes sold in February 2019. Last month’s sales were 46.3 per…

February 2019 Real Estate Board of Greater Vancouver Statistics Package with Charts & Graphs

February 2019 Real Estate Board of Greater Vancouver Statistics Package with Charts & Graphs

   The Metro Vancouver* housing market saw increased supply from home sellers and below average demand from home buyers in February. The Real Estate Board of Greater Vancouver (REBGV) reports that residential home sales in the region totalled 1,484 in February 2019, a 32.8 per cent decrease from the 2,207 sales recorded in February…

January 2019 Real Estate Board of Greater Vancouver Statistics Package with Charts & Graphs

January 2019 Real Estate Board of Greater Vancouver Statistics Package with Charts & Graphs

  Home listings continue to increase across all housing categories in the Metro Vancouver housing market while home buyer activity remains below historical averages. The Real Estate Board of Greater Vancouver (REBGV) reports that residential home sales in the region totalled 1,103 in January 2019, a 39.3 per cent decrease from the 1,818 sales…

December 2018 Real Estate Board of Greater Vancouver Statistics Package with Charts & Graphs

December 2018 Real Estate Board of Greater Vancouver Statistics Package with Charts & Graphs

  Metro Vancouver home sales in 2018 were the lowest annual total in the region since 2000. The Real Estate Board of Greater Vancouver (REBGV) reports that sales of detached, attached and apartment properties reached 24,619 on the Multiple Listing Service® (MLS®) in 2018, a 31.6 per cent decrease from the 35,993 sales recorded…

End of content

End of content