August 2019 Fraser Valley Real Estate Board Statistics Package with Charts & Graphs

August 2019 Fraser Valley Real Estate Board Statistics Package with Charts & Graphs

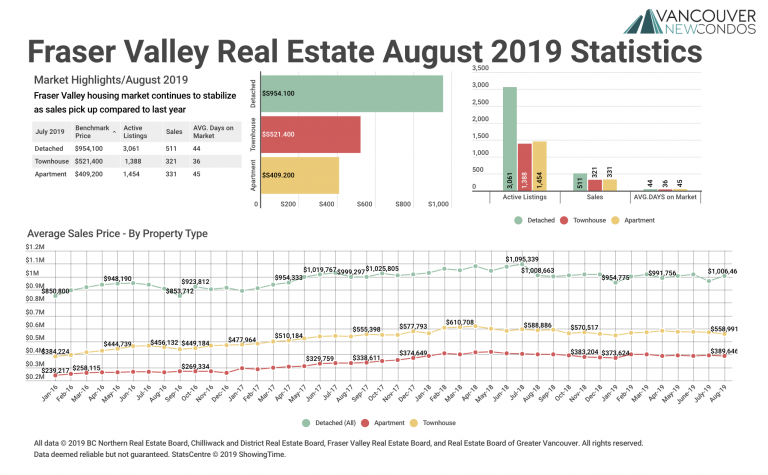
 Fraser Valley housing market continues to stabilize as sales pick up compared to last year SURREY, BC – For the second month in a row, home sales in the Fraser Valley surpassed 2018 levels bringing the market closer to historical norms. The Fraser Valley Real Estate Board processed 1,297 sales of all property types…

August 2019 Real Estate Board of Greater Vancouver Statistics Package with Charts & Graphs

August 2019 Real Estate Board of Greater Vancouver Statistics Package with Charts & Graphs

  Metro Vancouver housing market sees summer uptick in sales VANCOUVER, BC – September 4, 2019 – Home buyer activity increased to more typical levels in Metro Vancouver* throughout the summer months. The Real Estate Board of Greater Vancouver (REBGV) reports that residential home sales in the region totalled 2,231 in August 2019, a…

July 2019 Victoria Real Estate Board Statistics Package with Charts & Graphs

July 2019 Victoria Real Estate Board Statistics Package with Charts & Graphs

 A lukewarm spring comes to an end for the Victoria Real Estate market A total of 706 properties sold in the Victoria Real Estate Board region this July, 8.4 per cent more than the 651 properties sold in July 2018 but a 4.6 per cent decrease from June 2019. Sales of condominiums were up…

July 2019 Fraser Valley Real Estate Board Statistics Package with Charts & Graphs

July 2019 Fraser Valley Real Estate Board Statistics Package with Charts & Graphs

 Fraser Valley home sales rebound in July after lackluster June SURREY, BC – A noticeable lift in home sales and slight decrease in new listings bolstered the Fraser Valley housing market in July. The Fraser Valley Real Estate Board processed 1,458 sales of all property types on its Multiple Listing Service® (MLS®) in July,…

July 2019 Real Estate Board of Greater Vancouver Statistics Package with Charts & Graphs

July 2019 Real Estate Board of Greater Vancouver Statistics Package with Charts & Graphs

  Home sales increase in July Home buyer demand picked up across Metro Vancouver* last month, making July, a traditionally quieter month in real estate, the second highest selling month so far this year. The Real Estate Board of Greater Vancouver (REBGV) reports that residential home sales in the region totalled 2,557 in July…

June 2019 Victoria Real Estate Board Statistics Package with Charts & Graphs

June 2019 Victoria Real Estate Board Statistics Package with Charts & Graphs

 A lukewarm spring comes to an end for the Victoria Real Estate market A total of 740 properties sold in the Victoria Real Estate Board region this June, 4.5 per cent more than the 708 properties sold in June 2018 but a 12.7 per cent decrease from May 2019. Sales of condominiums were down…

June 2019 Fraser Valley Real Estate Board Statistics Package with Charts & Graphs

June 2019 Fraser Valley Real Estate Board Statistics Package with Charts & Graphs

 Both buyers and sellers taking a wait‐and‐see approach in the Fraser Valley SURREY, BC – Last month’s property sales in the Fraser Valley were 29.3 per cent below the 10‐year sales average for June and were the second lowest total for the month since the year 2000. The number of new listings also decreased…

June 2019 Real Estate Board of Greater Vancouver Statistics Package with Charts & Graphs

June 2019 Real Estate Board of Greater Vancouver Statistics Package with Charts & Graphs

  Housing supply up, home sales and prices down in June With home buyer demand below long-term historical averages in June, the supply of homes for sale continued to accumulate in Metro Vancouver. The Real Estate Board of Greater Vancouver (REBGV) reports that residential home sales in the region totalled 2,077 in June 2019,…

May 2019 Real Estate Board of Greater Vancouver Statistics Package with Charts & Graphs

May 2019 Real Estate Board of Greater Vancouver Statistics Package with Charts & Graphs

 May sees modest increase in home sales while housing supply reaches five-year high Monthly Metro Vancouver1 home sales eclipsed 2,000 for the first time this year in May, although home buyer demand remains below historical averages. The Real Estate Board of Greater Vancouver (REBGV) reports that residential home sales in the region totalled 2,638…

April 2019 Real Estate Board of Greater Vancouver Statistics Package with Charts & Graphs

April 2019 Real Estate Board of Greater Vancouver Statistics Package with Charts & Graphs

  Decreased demand continues to allow the supply of homes for sale to accumulate across the Metro Vancouver* housing market.The Real Estate Board of Greater Vancouver (REBGV) reports that residential home sales in the region totalled 1,829 in April 2019, a 29.1 per cent decrease from the 2,579 sales recorded in April 2018, and…

March 2019 Real Estate Board of Greater Vancouver Statistics Package with Charts & Graphs

March 2019 Real Estate Board of Greater Vancouver Statistics Package with Charts & Graphs

 The Real Estate Board of Greater Vancouver (REBGV) reports that residential home sales in the region totalled 1,727 in March 2019, a 31.4 per cent decrease from the 2,517 sales recorded in March 2018, and a 16.4 per cent increase from the 1,484 homes sold in February 2019. Last month’s sales were 46.3 per…

February 2019 Real Estate Board of Greater Vancouver Statistics Package with Charts & Graphs

February 2019 Real Estate Board of Greater Vancouver Statistics Package with Charts & Graphs

   The Metro Vancouver* housing market saw increased supply from home sellers and below average demand from home buyers in February. The Real Estate Board of Greater Vancouver (REBGV) reports that residential home sales in the region totalled 1,484 in February 2019, a 32.8 per cent decrease from the 2,207 sales recorded in February…

End of content

End of content