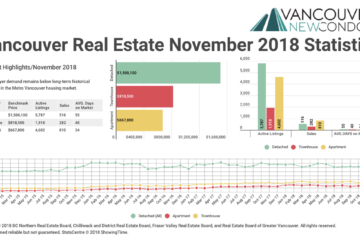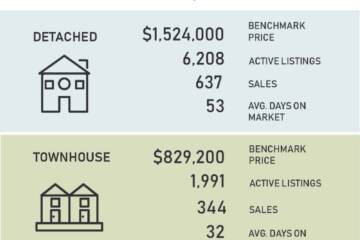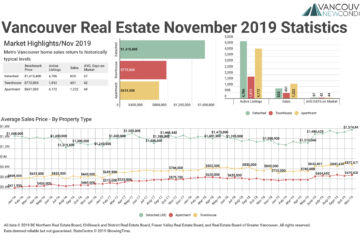
November 2019 Real Estate Board of Greater Vancouver Statistics Package with Charts & Graphs
Metro Vancouver home sales return to historically typical levels VANCOUVER, BC – December 3, 2019 – After a quieter first half of 2019, home buyer activity has returned…