September 2019 Fraser Valley Real Estate Board Statistics Package with Charts & Graphs

September 2019 Fraser Valley Real Estate Board Statistics Package with Charts & Graphs

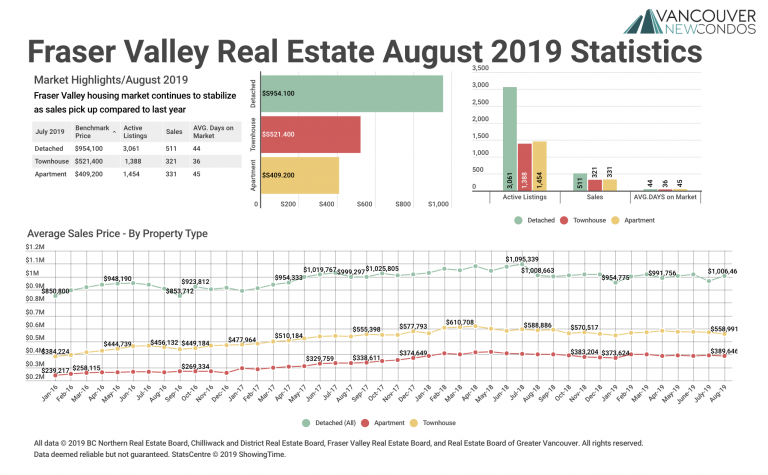
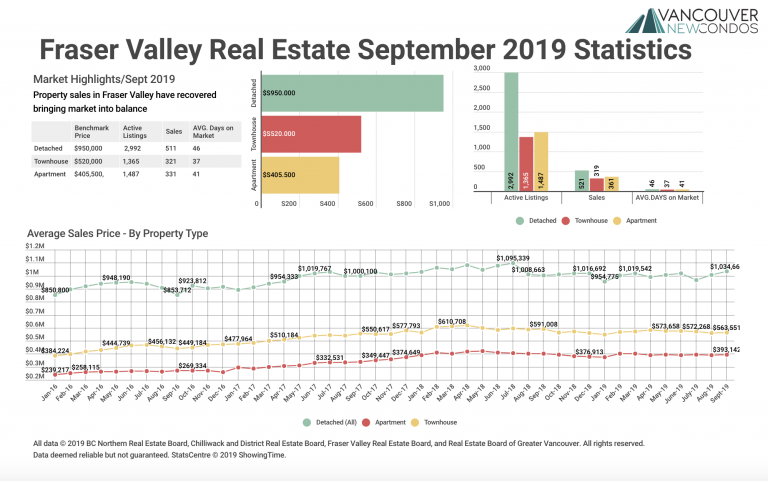
 Property sales in Fraser Valley have recovered bringing market into balance SURREY, BC – For the third straight month, home sales in the Fraser Valley surpassed 2018 levels bringing the market back in line with long‐term averages. The Fraser Valley Real Estate Board processed 1,343 sales of all property types on its Multiple Listing…

September 2019 Real Estate Board of Greater Vancouver Statistics Package with Charts & Graphs

September 2019 Real Estate Board of Greater Vancouver Statistics Package with Charts & Graphs

  Increased demand helps housing market reach balanced territory VANCOUVER, BC – October 2, 2019 – Home buyer demand has returned to more historically typical levels in Metro Vancouver* over the last three months. The Real Estate Board of Greater Vancouver (REBGV) reports that residential home sales in the region totalled 2,333 in September…

August 2019 Victoria Real Estate Board Statistics Package with Charts & Graphs

August 2019 Victoria Real Estate Board Statistics Package with Charts & Graphs

 Victoria real estate summer sales and inventory levels follow historic patterns A total of 661 properties sold in the Victoria Real Estate Board region this August, 11.3 per cent more than the 594 properties sold in August 2018 but a 6.4 per cent decrease from July 2019. Sales of condominiums were up 4.1 per…

August 2019 Fraser Valley Real Estate Board Statistics Package with Charts & Graphs

August 2019 Fraser Valley Real Estate Board Statistics Package with Charts & Graphs

 Fraser Valley housing market continues to stabilize as sales pick up compared to last year SURREY, BC – For the second month in a row, home sales in the Fraser Valley surpassed 2018 levels bringing the market closer to historical norms. The Fraser Valley Real Estate Board processed 1,297 sales of all property types…

August 2019 Real Estate Board of Greater Vancouver Statistics Package with Charts & Graphs

August 2019 Real Estate Board of Greater Vancouver Statistics Package with Charts & Graphs

  Metro Vancouver housing market sees summer uptick in sales VANCOUVER, BC – September 4, 2019 – Home buyer activity increased to more typical levels in Metro Vancouver* throughout the summer months. The Real Estate Board of Greater Vancouver (REBGV) reports that residential home sales in the region totalled 2,231 in August 2019, a…

July 2019 Victoria Real Estate Board Statistics Package with Charts & Graphs

July 2019 Victoria Real Estate Board Statistics Package with Charts & Graphs

 A lukewarm spring comes to an end for the Victoria Real Estate market A total of 706 properties sold in the Victoria Real Estate Board region this July, 8.4 per cent more than the 651 properties sold in July 2018 but a 4.6 per cent decrease from June 2019. Sales of condominiums were up…

July 2019 Fraser Valley Real Estate Board Statistics Package with Charts & Graphs

July 2019 Fraser Valley Real Estate Board Statistics Package with Charts & Graphs

 Fraser Valley home sales rebound in July after lackluster June SURREY, BC – A noticeable lift in home sales and slight decrease in new listings bolstered the Fraser Valley housing market in July. The Fraser Valley Real Estate Board processed 1,458 sales of all property types on its Multiple Listing Service® (MLS®) in July,…

July 2019 Real Estate Board of Greater Vancouver Statistics Package with Charts & Graphs

July 2019 Real Estate Board of Greater Vancouver Statistics Package with Charts & Graphs

  Home sales increase in July Home buyer demand picked up across Metro Vancouver* last month, making July, a traditionally quieter month in real estate, the second highest selling month so far this year. The Real Estate Board of Greater Vancouver (REBGV) reports that residential home sales in the region totalled 2,557 in July…

June 2019 Victoria Real Estate Board Statistics Package with Charts & Graphs

June 2019 Victoria Real Estate Board Statistics Package with Charts & Graphs

 A lukewarm spring comes to an end for the Victoria Real Estate market A total of 740 properties sold in the Victoria Real Estate Board region this June, 4.5 per cent more than the 708 properties sold in June 2018 but a 12.7 per cent decrease from May 2019. Sales of condominiums were down…

June 2019 Fraser Valley Real Estate Board Statistics Package with Charts & Graphs

June 2019 Fraser Valley Real Estate Board Statistics Package with Charts & Graphs

 Both buyers and sellers taking a wait‐and‐see approach in the Fraser Valley SURREY, BC – Last month’s property sales in the Fraser Valley were 29.3 per cent below the 10‐year sales average for June and were the second lowest total for the month since the year 2000. The number of new listings also decreased…

June 2019 Real Estate Board of Greater Vancouver Statistics Package with Charts & Graphs

June 2019 Real Estate Board of Greater Vancouver Statistics Package with Charts & Graphs

  Housing supply up, home sales and prices down in June With home buyer demand below long-term historical averages in June, the supply of homes for sale continued to accumulate in Metro Vancouver. The Real Estate Board of Greater Vancouver (REBGV) reports that residential home sales in the region totalled 2,077 in June 2019,…

End of content

End of content