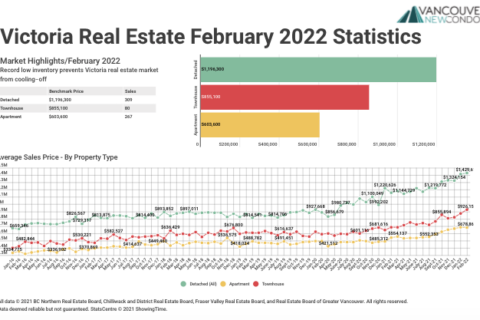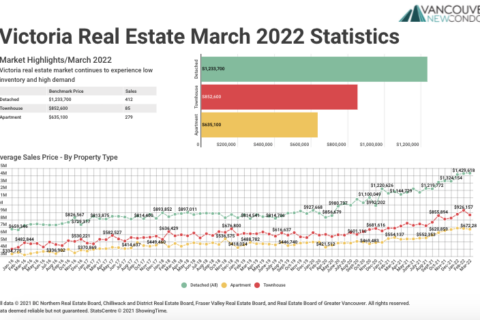
March 2022 Victoria Real Estate Board Statistics Package with Charts & Graphs
Victoria real estate market continues to experience low inventory and high demand A total of 833 properties sold in the Victoria Real Estate Board region this March, 29 per cent fewer than the 1,173 properties sold in March 2021 but a 16 per cent increase from February 2022. Sales of condominiums were down 26…