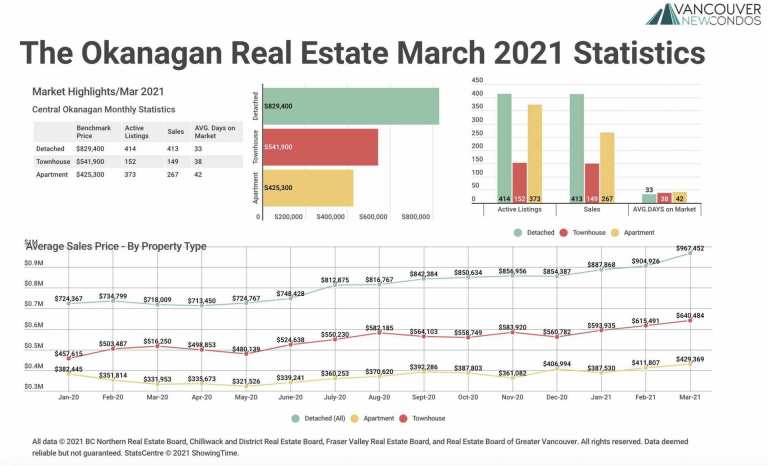
March 2021 The Okanagan Real Estate Statistics Package with Charts & Graphs
1. Areas covered by the Association of Interior REALTORS® Market Statistics include: Central/North Okanagan, Shuswap/ Revelstoke, South Okanagan/ South Peace River Statistics for Related Areas Fraser Valley Real Estate Stats Vancouver Real Estate Stats Victoria Real Estate Stats Statistics from Recent Months February 2021 Okanagan Real Estate Stats