June 2021 The Okanagan Real Estate Statistics Package with Charts & Graphs
|

June 2021 The Okanagan Real Estate Statistics Package with Charts & Graphs

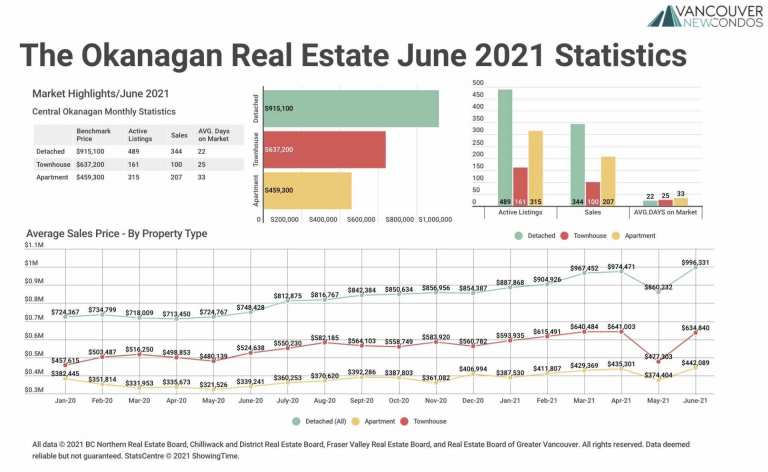
 1. Areas covered by the Association of Interior REALTORS® Market Statistics include: Central/North Okanagan, Shuswap/ Revelstoke, South Okanagan/ South Peace River Statistics for Related Areas Fraser Valley Real Estate Stats Vancouver Real Estate Stats Victoria Real Estate Stats Statistics from Recent Months May 2021 Okanagan Real Estate Stats April 2021 Okanagan Real Estate Stats…

June 2021 Victoria Real Estate Board Statistics Package with Charts & Graphs

June 2021 Victoria Real Estate Board Statistics Package with Charts & Graphs

 Low inventory and strong demand continue in Victoria real estate market A total of 942 properties sold in the Victoria Real Estate Board region this June, 16.6 per cent more than the 808 properties sold in June 2020, but 10.2 per cent fewer than the previous month of May. Condominium sales were up 61.7…

June 2021 Real Estate Board of Greater Vancouver Statistics Package with Charts & Graphs

June 2021 Real Estate Board of Greater Vancouver Statistics Package with Charts & Graphs

 Metro Vancouver’s housing market sets a steady, calmer pace to begin the summer season VANCOUVER, BC – July 5, 2021 – While still elevated, home sale and listing activity in Metro Vancouver* has eased back from the record-setting pace seen in March and April of this year. The Real Estate Board of Greater Vancouver…

End of content

End of content