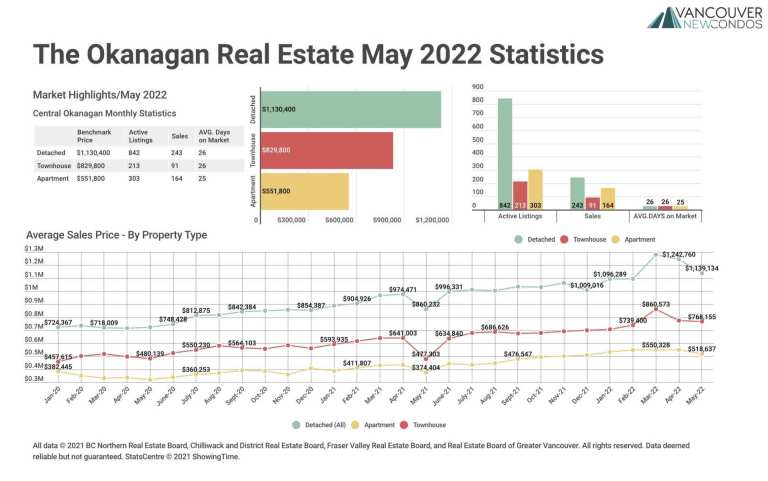
May 2022 The Okanagan Real Estate Statistics Package with Charts & Graphs
|

May 2022 The Okanagan Real Estate Statistics Package with Charts & Graphs

  1. Areas covered by the Association of Interior REALTORS® Market Statistics include: Central/North Okanagan, Shuswap/ Revelstoke, South Okanagan/ South Peace River Statistics for Related Areas Vancouver Real Estate Stats Fraser Valley Real Estate Stats Victoria Real Estate Stats Statistics from Recent Months April 2022 Okanagan Real Estate Stats March 2022 Okanagan Real Estate…

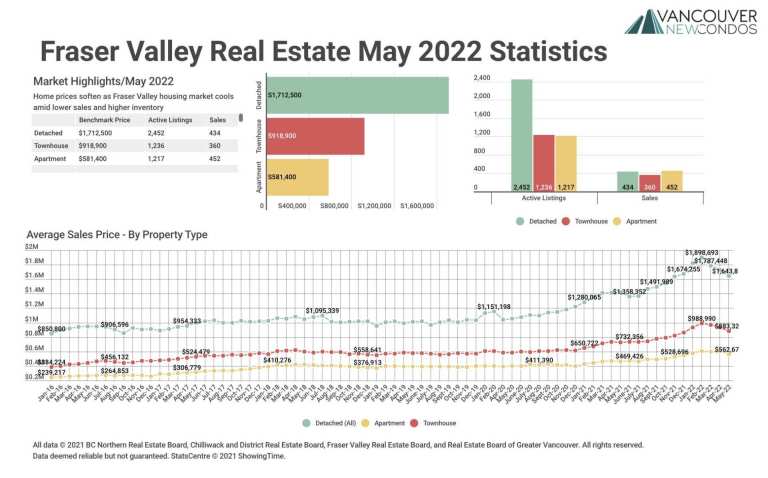
May 2022 Fraser Valley Real Estate Board Statistics Package with Charts & Graphs

May 2022 Fraser Valley Real Estate Board Statistics Package with Charts & Graphs

 Home prices soften as Fraser Valley housing market cools amid lower sales and higher inventory SURREY, BC – As property sales continue to fall in the Fraser Valley and active listings continue to grow, the region is edging towards more balanced levels not seen since the pre-pandemic period. Sales of all property types in…

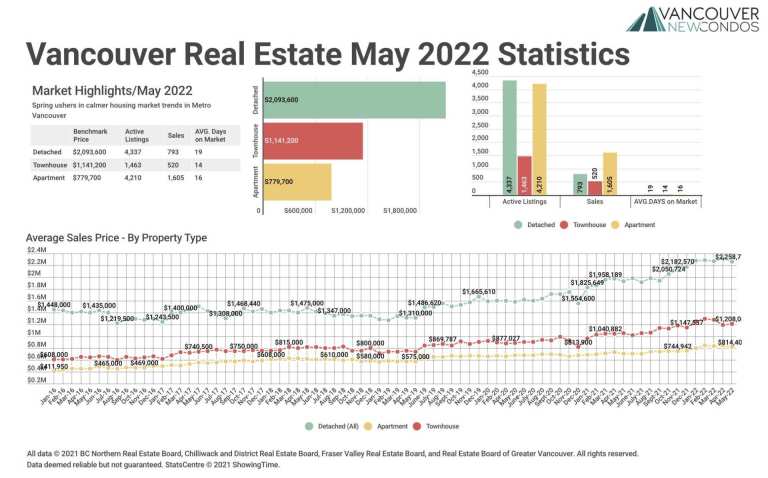
May 2022 Real Estate Board of Greater Vancouver Statistics Package with Charts & Graphs

May 2022 Real Estate Board of Greater Vancouver Statistics Package with Charts & Graphs

 Spring ushers in calmer housing market trends in Metro Vancouver VANCOUVER, BC – June 2, 2022 – After reaching record-setting levels in 2021, home sale activity has returned to more typical seasonal levels in Metro Vancouver* this spring due, in large part, to rising interest rates. The Real Estate Board of Greater Vancouver (REBGV)…

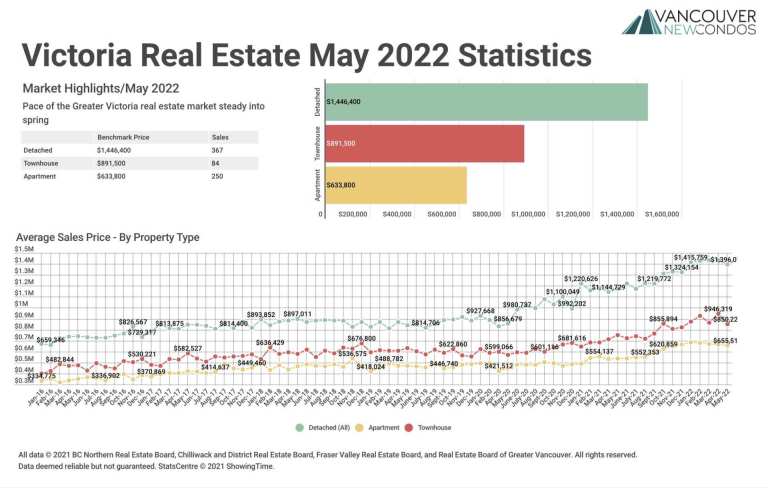
May 2022 Victoria Real Estate Board Statistics Package with Charts & Graphs

May 2022 Victoria Real Estate Board Statistics Package with Charts & Graphs

 Pace of the Greater Victoria real estate market steady into spring A total of 761 properties sold in the Victoria Real Estate Board region this May, 27.5 per cent fewer than the 1,049 properties sold in May 2021 and a 7.6 per cent decrease from April 2022. Sales of condominiums were down 23.1 per…

End of content

End of content