| |

Real Estate Outlook Vancouver 2021 – June Webinar

Vancouver Market Update: June Market update May 2021 listings were 187% higher than the same month last year, but there was also a 13% decrease in homes sold from the prior month. When the sales-active listing ratio is below 12%, analysts believe prices will trend downward. When the ratio is above 20%, prices should trend…

September 2021 British Columbia Real Estate Association Statistics

 Record-Low Supply Keeps Market Conditions Tight in September Vancouver, BC – October 12, 2021. The British Columbia Real Estate Association (BCREA) reports that a total of 9,164 residential unit sales were recorded by the Multiple Listing Service® (MLS®) in September 2021, a decrease of 19.9 per cent from September 2020. The average MLS® residential…

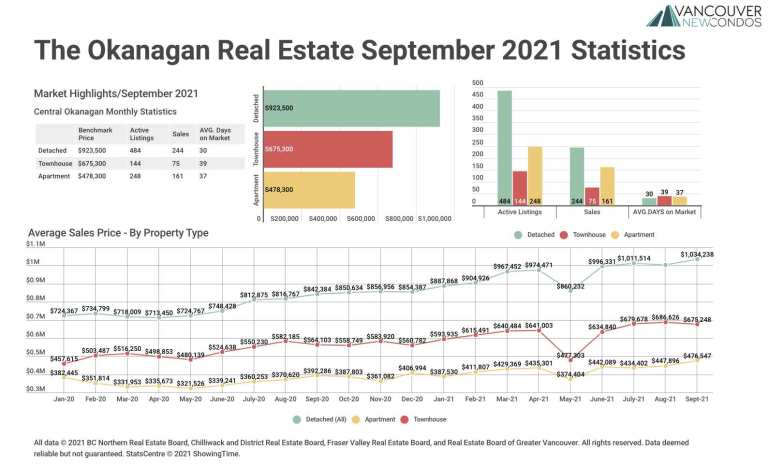
September 2021 The Okanagan Real Estate Statistics Package with Charts & Graphs
|

September 2021 The Okanagan Real Estate Statistics Package with Charts & Graphs

 1. Areas covered by the Association of Interior REALTORS® Market Statistics include: Central/North Okanagan, Shuswap/ Revelstoke, South Okanagan/ South Peace River Statistics for Related Areas Fraser Valley Real Estate Stats Vancouver Real Estate Stats Victoria Real Estate Stats Statistics from Recent Months August 2021 Okanagan Real Estate Stats July 2021 Okanagan Real Estate Stats…

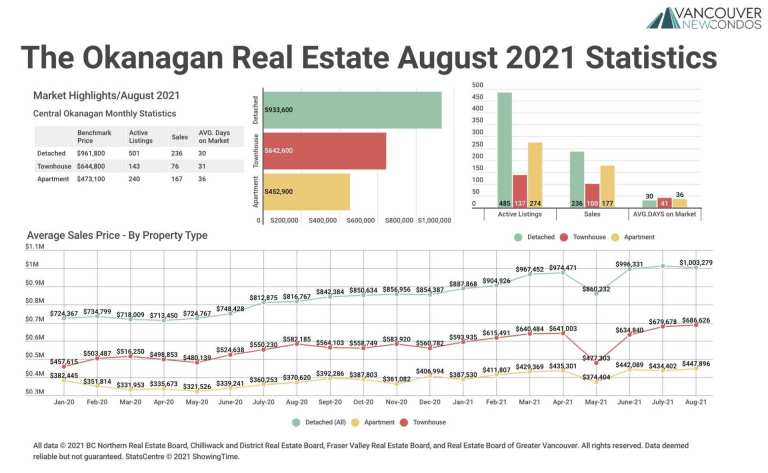
August 2021 The Okanagan Real Estate Statistics Package with Charts & Graphs
|

August 2021 The Okanagan Real Estate Statistics Package with Charts & Graphs

 1. Areas covered by the Association of Interior REALTORS® Market Statistics include: Central/North Okanagan, Shuswap/ Revelstoke, South Okanagan/ South Peace River Statistics for Related Areas Fraser Valley Real Estate Stats Vancouver Real Estate Stats Victoria Real Estate Stats Statistics from Recent Months July 2021 Okanagan Real Estate Stats June 2021 Okanagan Real Estate Stats…

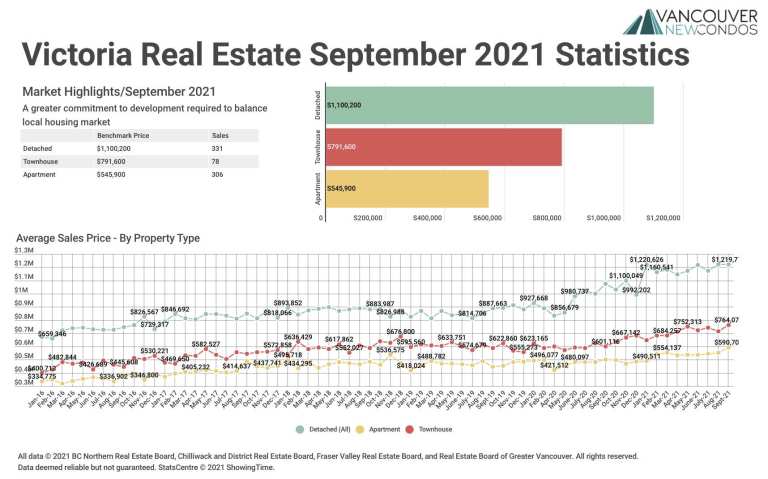
September 2021 Victoria Real Estate Board Statistics Package with Charts & Graphs

September 2021 Victoria Real Estate Board Statistics Package with Charts & Graphs

 A greater commitment to development required to balance local housing market A total of 761 properties sold in the Victoria Real Estate Board region this September, 23.1 per cent fewer than the 989 properties sold in September 2020 and 8.4 per cent fewer than the previous month of August. Condominium sales were up 9.3…

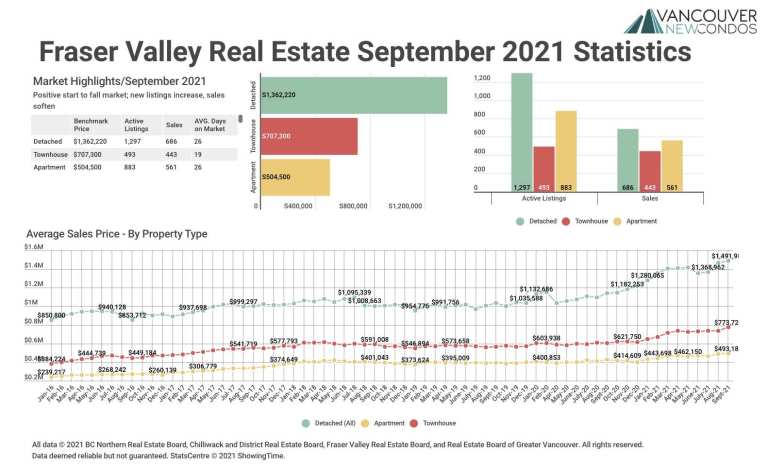
September 2021 Fraser Valley Real Estate Board Statistics Package with Charts & Graphs

September 2021 Fraser Valley Real Estate Board Statistics Package with Charts & Graphs

 Positive start to fall market; new listings increase, sales soften SURREY, BC – Demand for Fraser Valley real estate remained robust in September. While overall sales decreased compared to August, total sales reached the second‐highest levels for the month of September in the 100‐year history of the Board. The Board processed a total of…

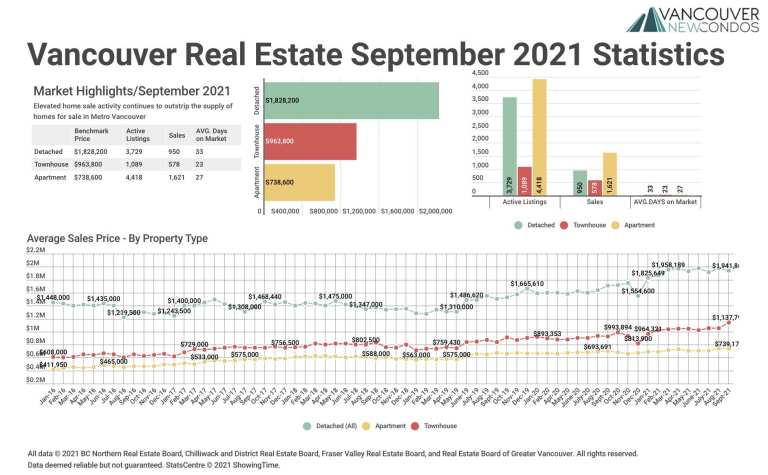
September 2021 Real Estate Board of Greater Vancouver Statistics Package with Charts & Graphs

September 2021 Real Estate Board of Greater Vancouver Statistics Package with Charts & Graphs

  Elevated home sale activity continues to outstrip the supply of homes for sale in Metro Vancouver VANCOUVER, BC – October 4, 2021 – Home sale activity remains elevated across Metro Vancouver’s* housing market while the pace of homes being listed for sale continues to follow long-term averages. The Real Estate Board of Greater…

End of content

End of content