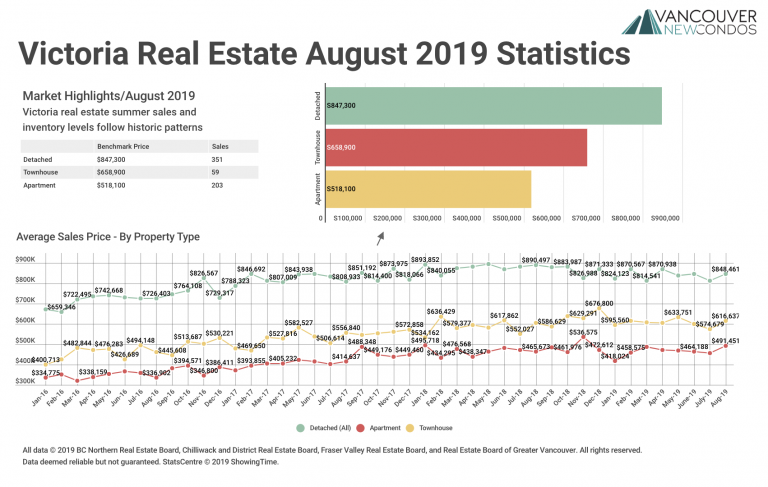
August 2019 Victoria Real Estate Board Statistics Package with Charts & Graphs
Victoria real estate summer sales and inventory levels follow historic patterns A total of 661 properties sold in the Victoria Real Estate Board region this August, 11.3 per cent more than the 594 properties sold in August 2018 but a 6.4 per cent decrease from July 2019. Sales of condominiums were up 4.1 per…